About the Unite Homepage Dashboards
When you log into Unite, the homepage contains multiple Unite admissions dashboards. These dashboards present information about your applicants, including the status of their application(s), residency (both state and country information), scholarships, and use of LSAC coupons for services like CAS reports and LSAT fees. JD instances of Unite also have a dashboard with admittance and yield rates by LSAT scores and GPAs. Each dashboard contains mini reports called tiles that provide information from your Unite database. The data for all dashboards is updated each day at midnight. The dashboards reset annually on November 1st. Many dashboards contain data tables that can be exported by selecting the ellipsis at the top of the list and selecting Export Data.
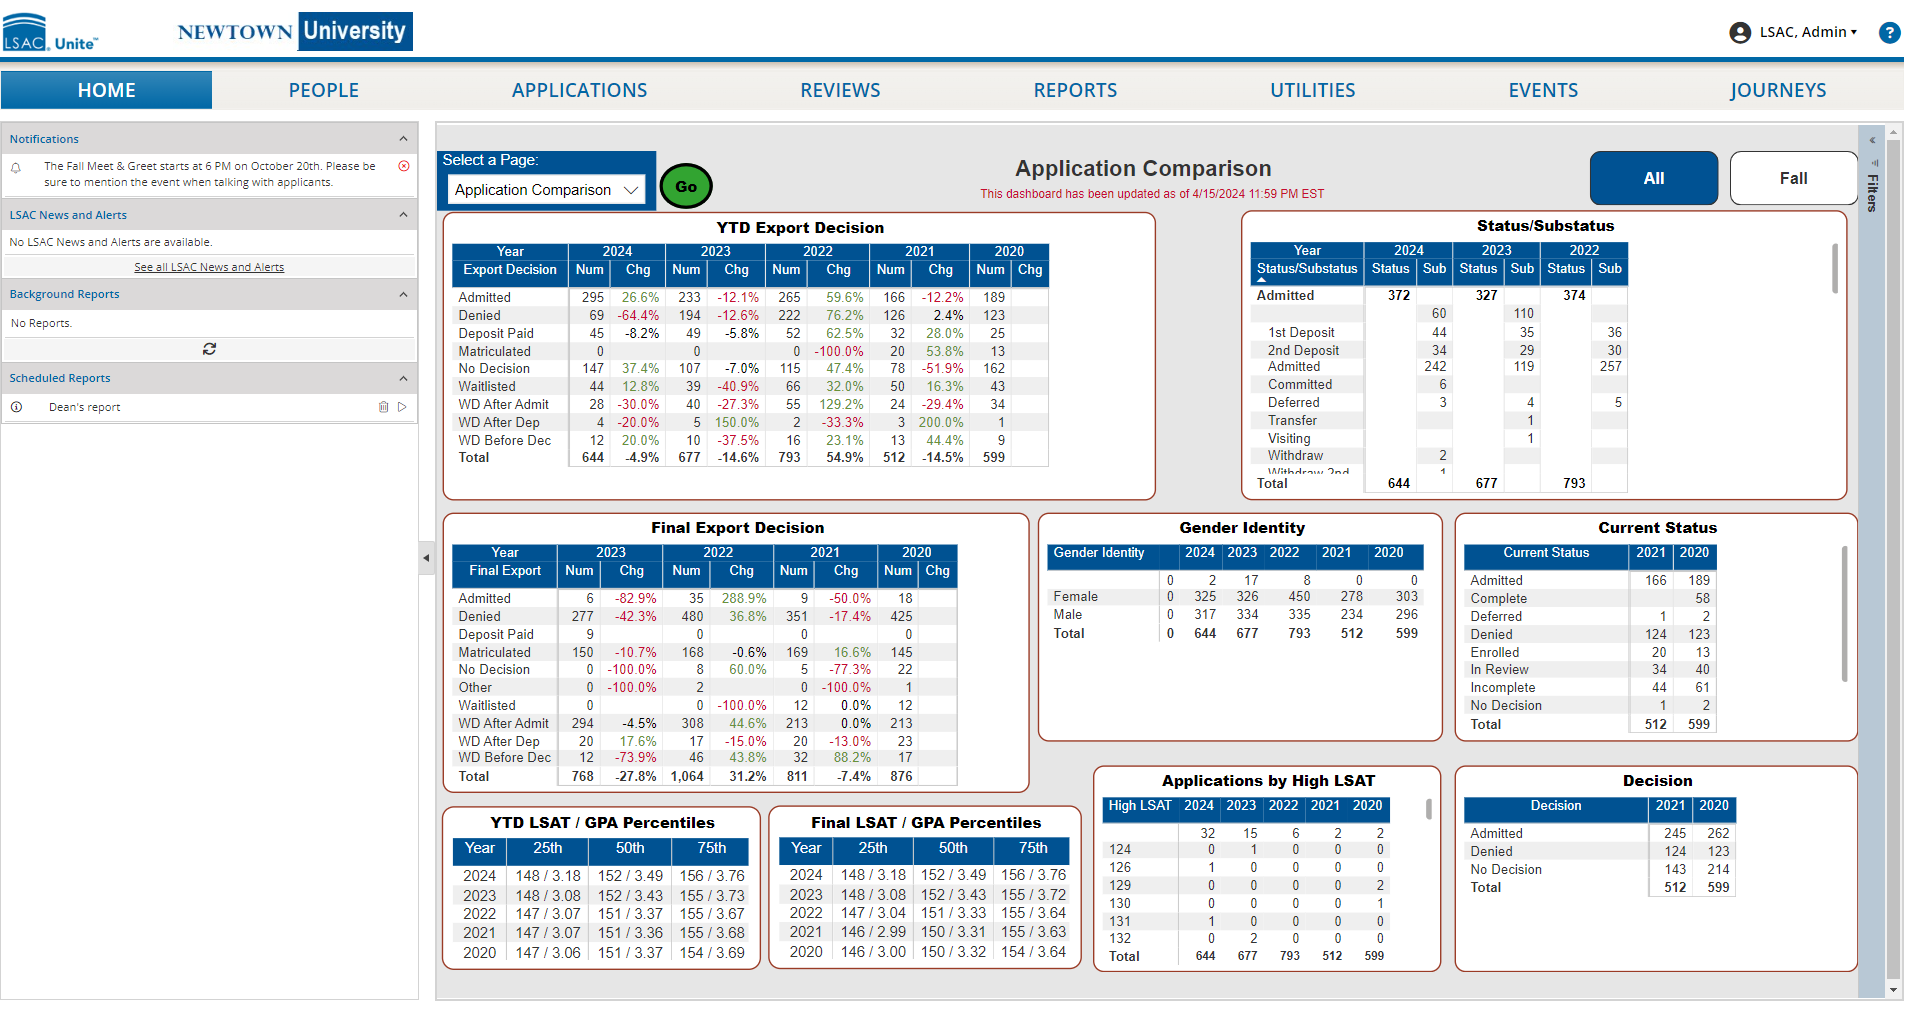
The Application Comparison Dashboard
The Application Comparison Dashboard is the dashboard that displays by default on the Unite homepage when logging in. This dashboard contains data about your applicants for this cycle and up to four years preceding this cycle. The tiles on this dashboard include the Year to Date Export Decision and the Final Export Decision, Status and Substatus, and Gender Identity. JD instances of Unite have tiles for Applications by High LSAT, Year to Date LSAT and GPA percentiles, and Final LSAT and GPA percentiles. LLM instances of Unite have a tile for Citizenship Type on the Application Comparison Dashboard. For the first few years after a school converts to Unite, the dashboard will also show ACES2 data from the four previous years for current and decision statuses (values that do not exist in Unite). The dashboard tiles are dynamic and work together. You can select one row or column of data in a tile and use CTRL to select additional rows or columns in other tiles; the dashboard tiles will then include only the data related to the rows or columns you selected.
The Data Dashboard
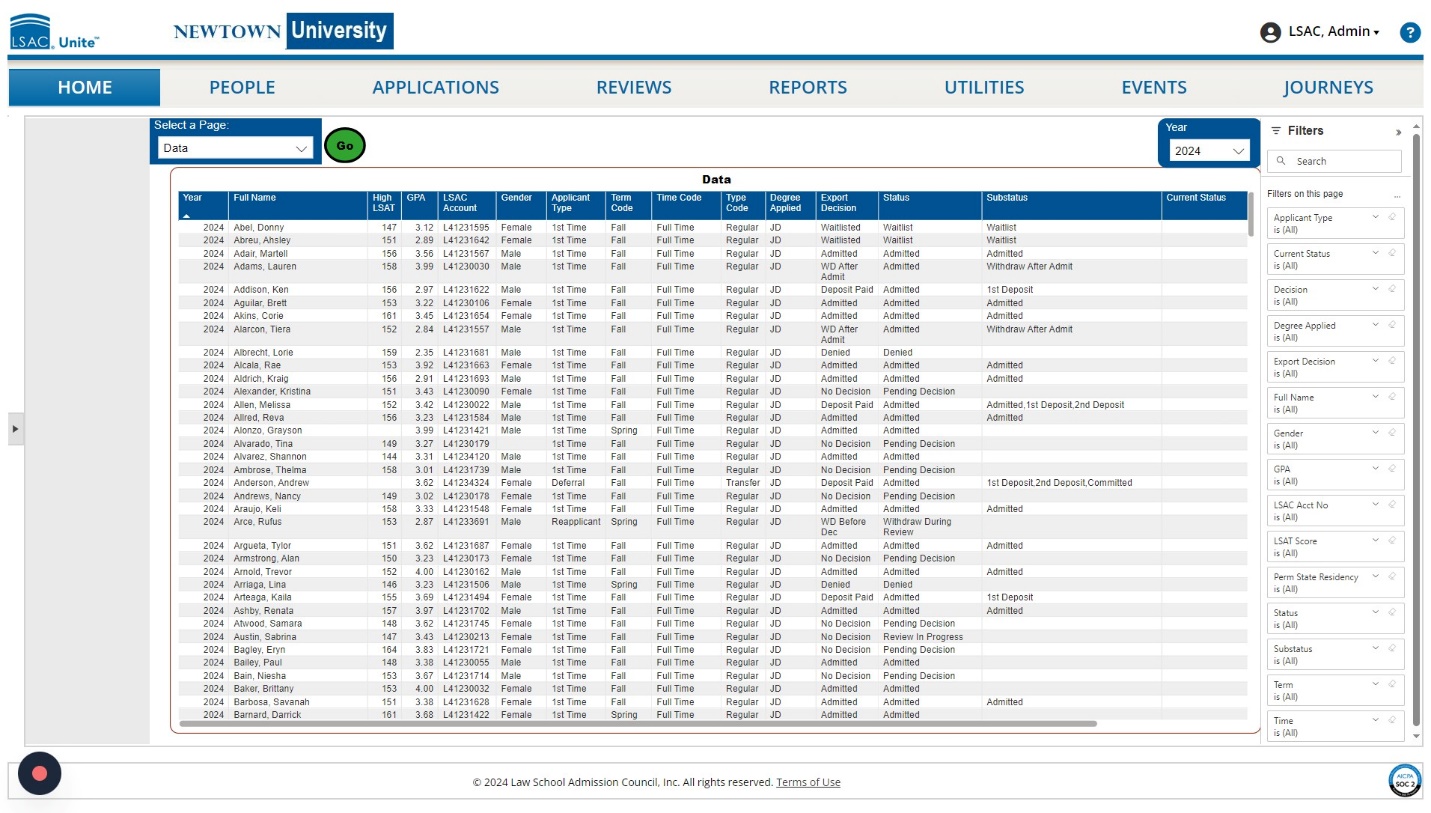
The Data Dashboard contains the underlying data – a table of all the people – for everyone included in the entire dashboard. Access it by selecting Data from the drop down menu in the Select a Page field located on the Homepage and then selecting Go. If desired, the table can be exported by selecting the ellipsis at the top of the list and selecting Export Data. The filter pane on the right side of the page allows you to filter the table by Application type, Applicant type, Term, Time, Degree Applied, and Residency. Each column in the table can be sorted in ascending or descending order by selecting/clicking on the header.
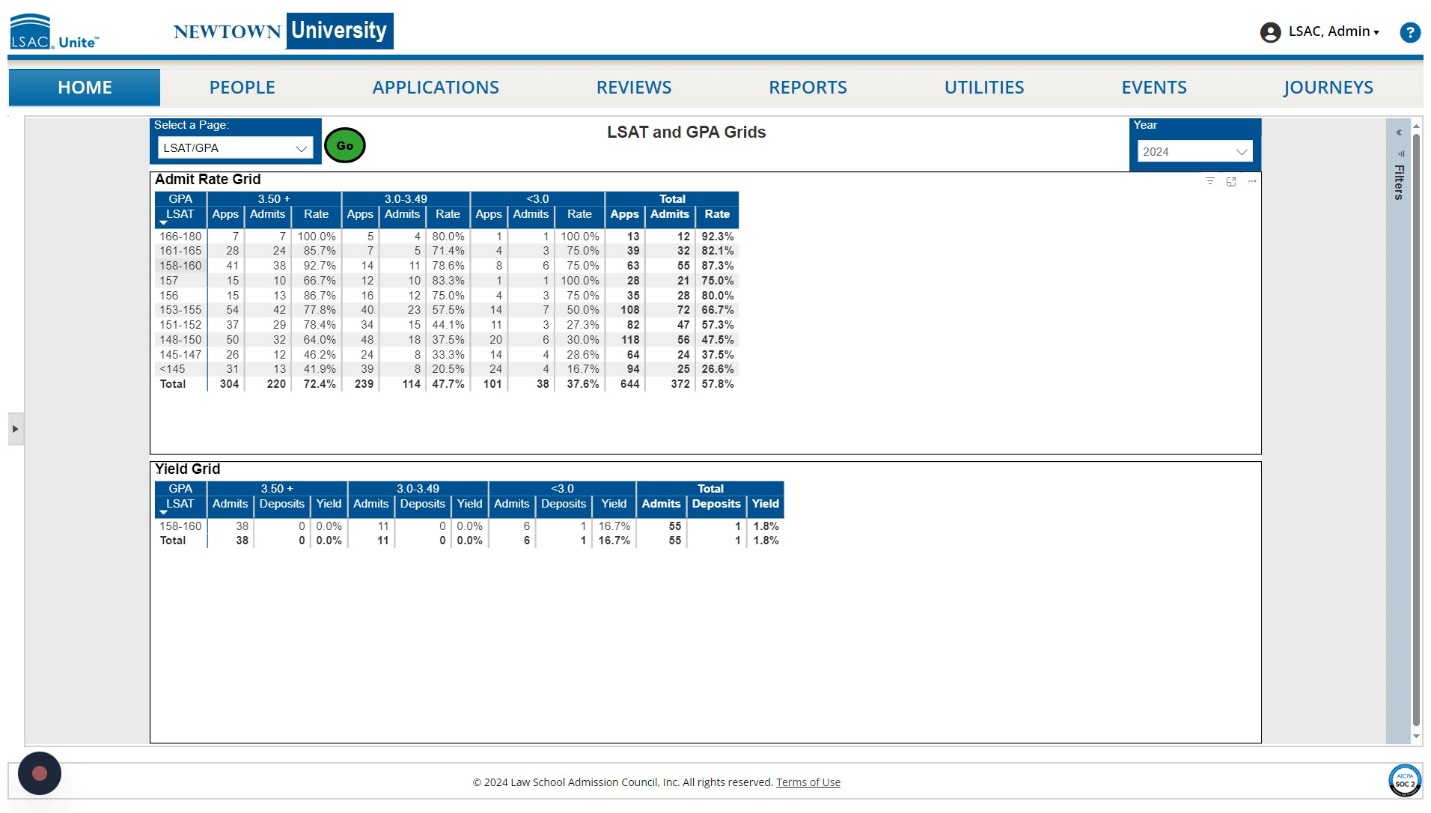
The LSAT/GPA Dashboard
JD instances of Unite have an LSAC/GPA dashboard with two grids that contain information about LSAT scores and GPAs for admitted and matriculated applicants for up to five years. Both grids are organized with LSAT Score on the Y axis (vertical) and GPA on the X (horizontal) axis. The LSAT score and GPA ranges can be customized to meet your schools needs and reflect your applicant pool.
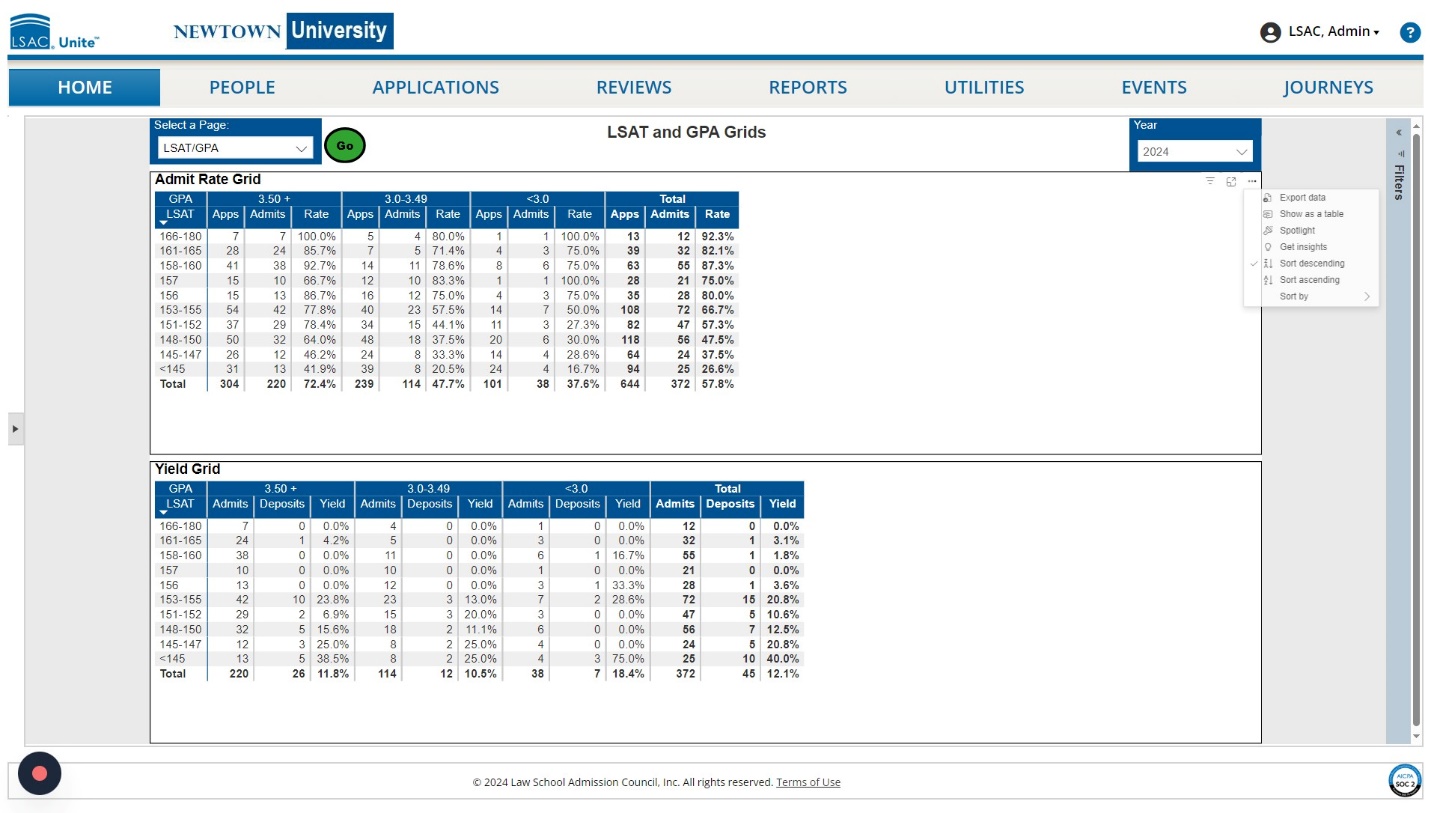
The LSAT and GPA grids are also dynamic and work together. For example, if you select one row for an LSAT score range in the Admit Rate grid, the Yield Rate grid will then display only the data related to applicants with scores within that range.
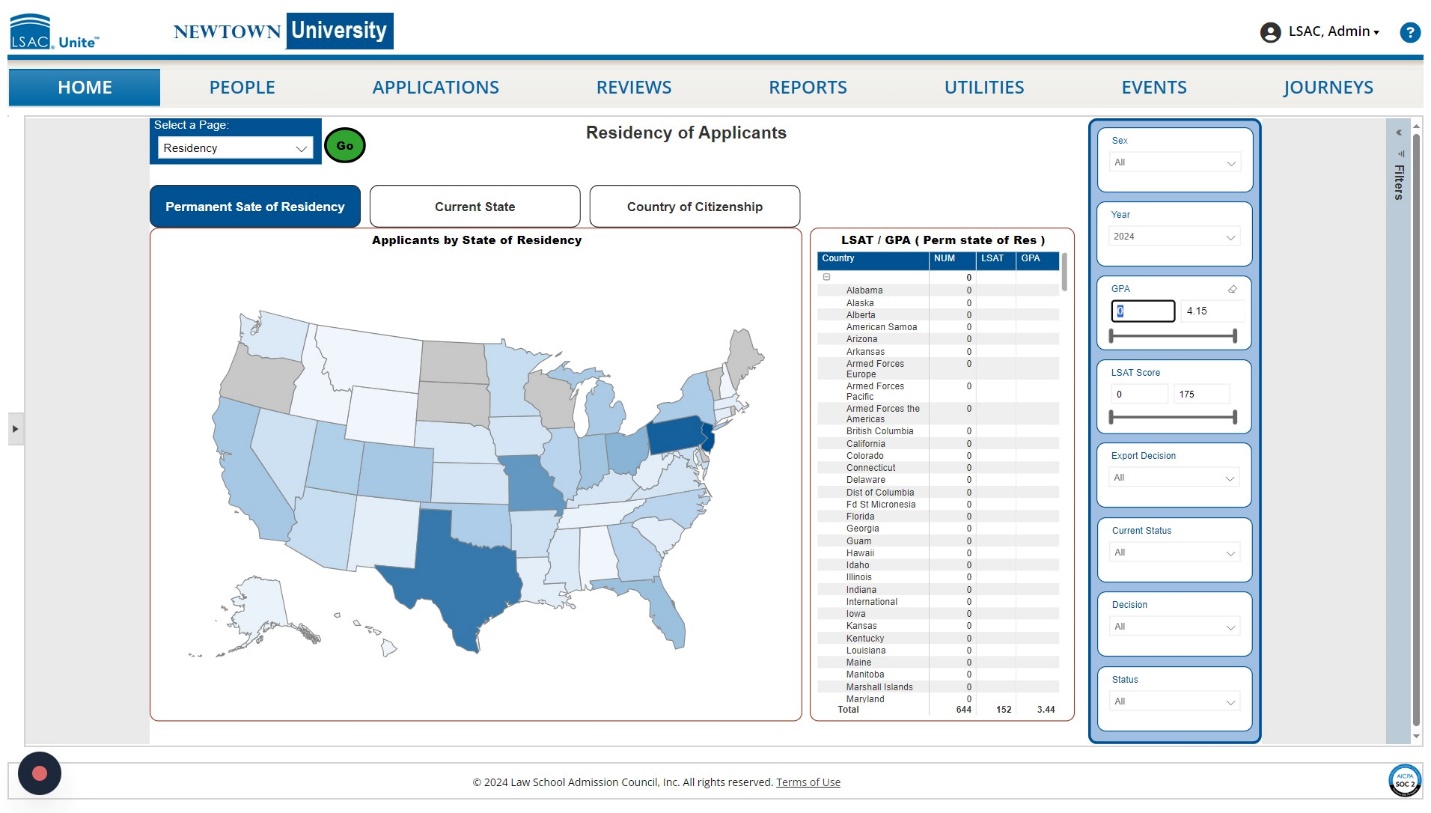
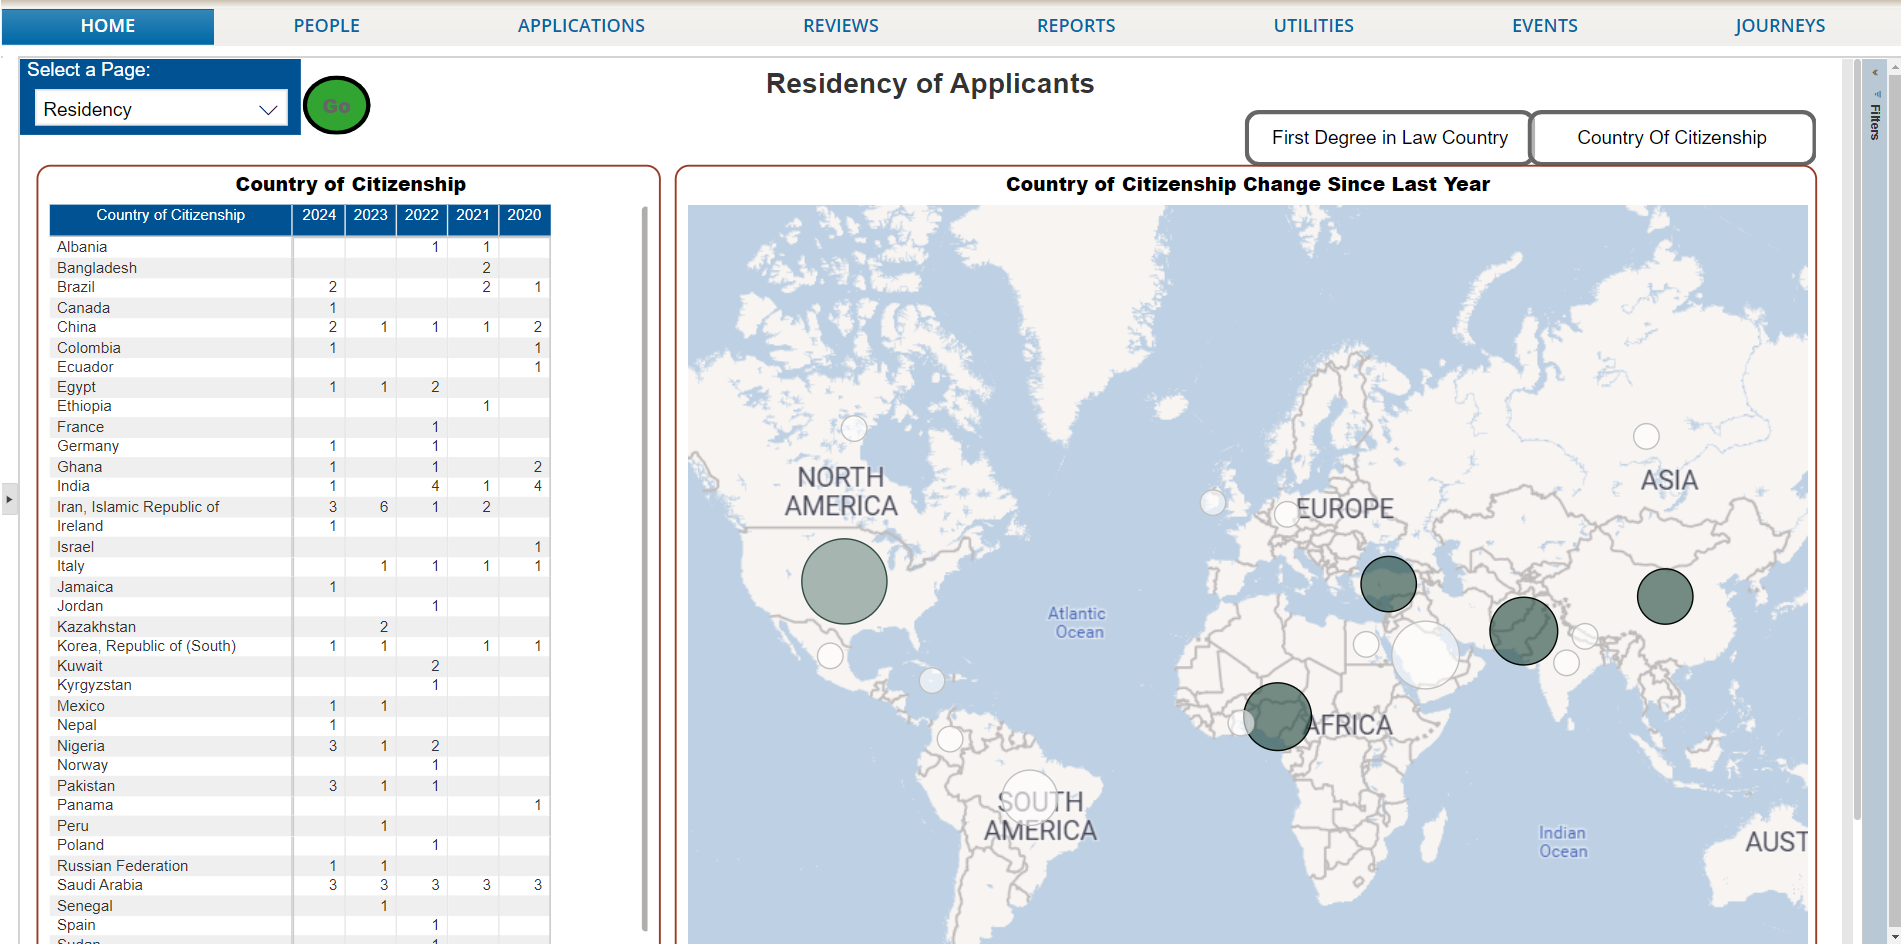
The Residency Dashboard
The Residency Dashboard contains residency information in an interactive map format as well as a data table. Selecting a state on the map will limit information in the table to applicants from the selected state. Filters interact with other elements of the dashboard to further focus the data. The dashboard contains different data for JD and LLM instances of Unite. JD instances of Unite contain information about the permanent state and current state of residency, as well as the country of citizenship for applicants.
LLM instances of Unite contain information about the Country of First Law Degree and Country of Citizenship for applicants.
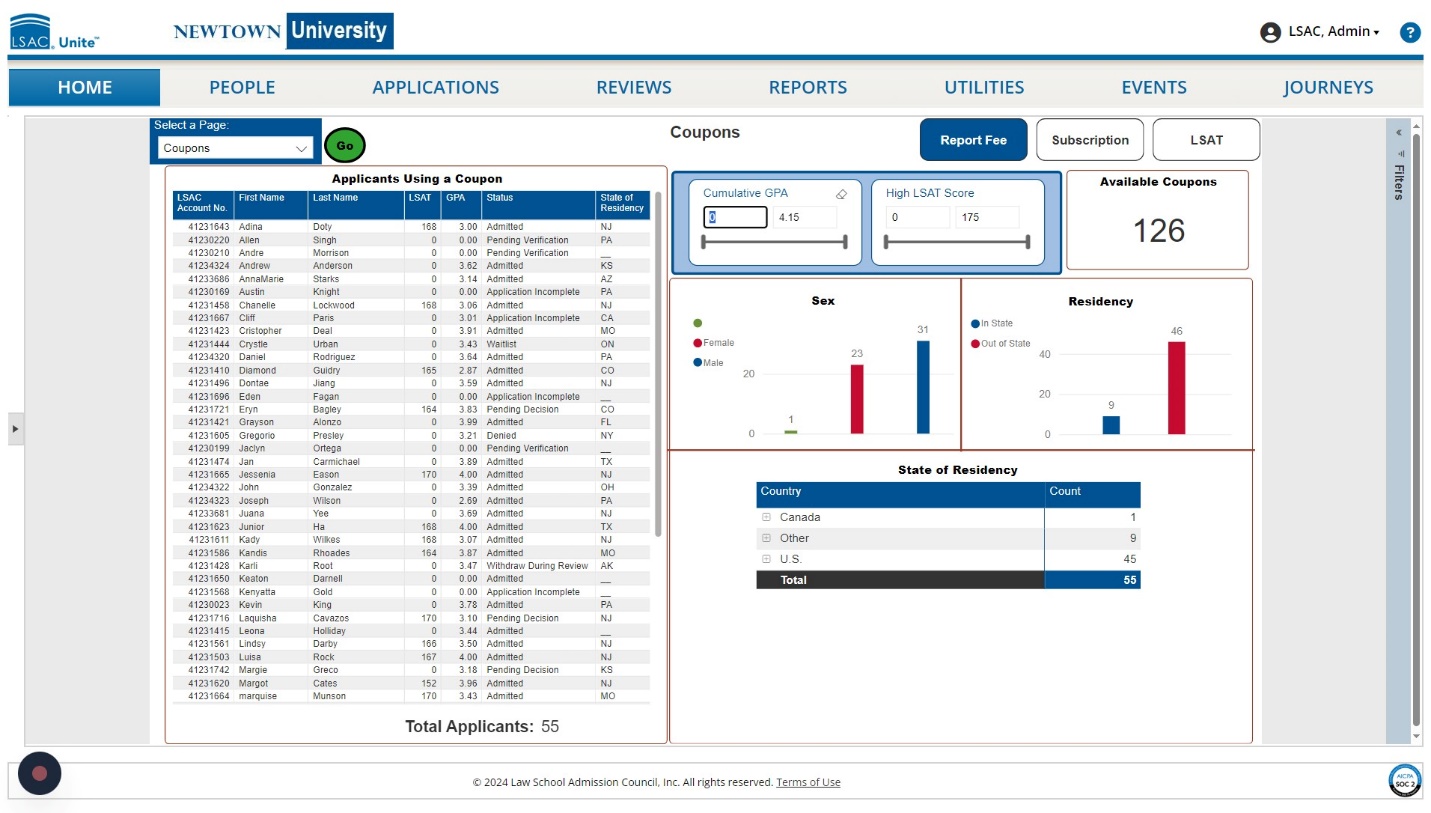
The Coupons Dashboard
The coupons dashboard allows schools to monitor the use of coupons they have provided to applicants to cover the cost of LSAC services, including the JD or LLM Credential Assembly Service (CAS) report, the JD CAS or LLM Document Assembly Service (DAS) five-year subscription, and the LLM International Transcript Authentication and Evaluation Service (ITAES) subscription. LSAC invoices schools monthly for any coupons that are redeemed. The dashboard includes information about who has redeemed a coupon, plus how many coupons are still available for redemption. A data table on the dashboard includes the names of applicants who have applied using a coupon. Filters interact with other elements of the dashboard to further focus the data.
The Scholarship Dashboard
The Scholarship Dashboard contains multiple tiles with information including year-over-year comparison of scholarship data including counts, total amounts, totals by name or type of scholarship, as well as final counts and yield for matriculants with scholarships. Filters interact with other elements of the dashboard to further focus the data.
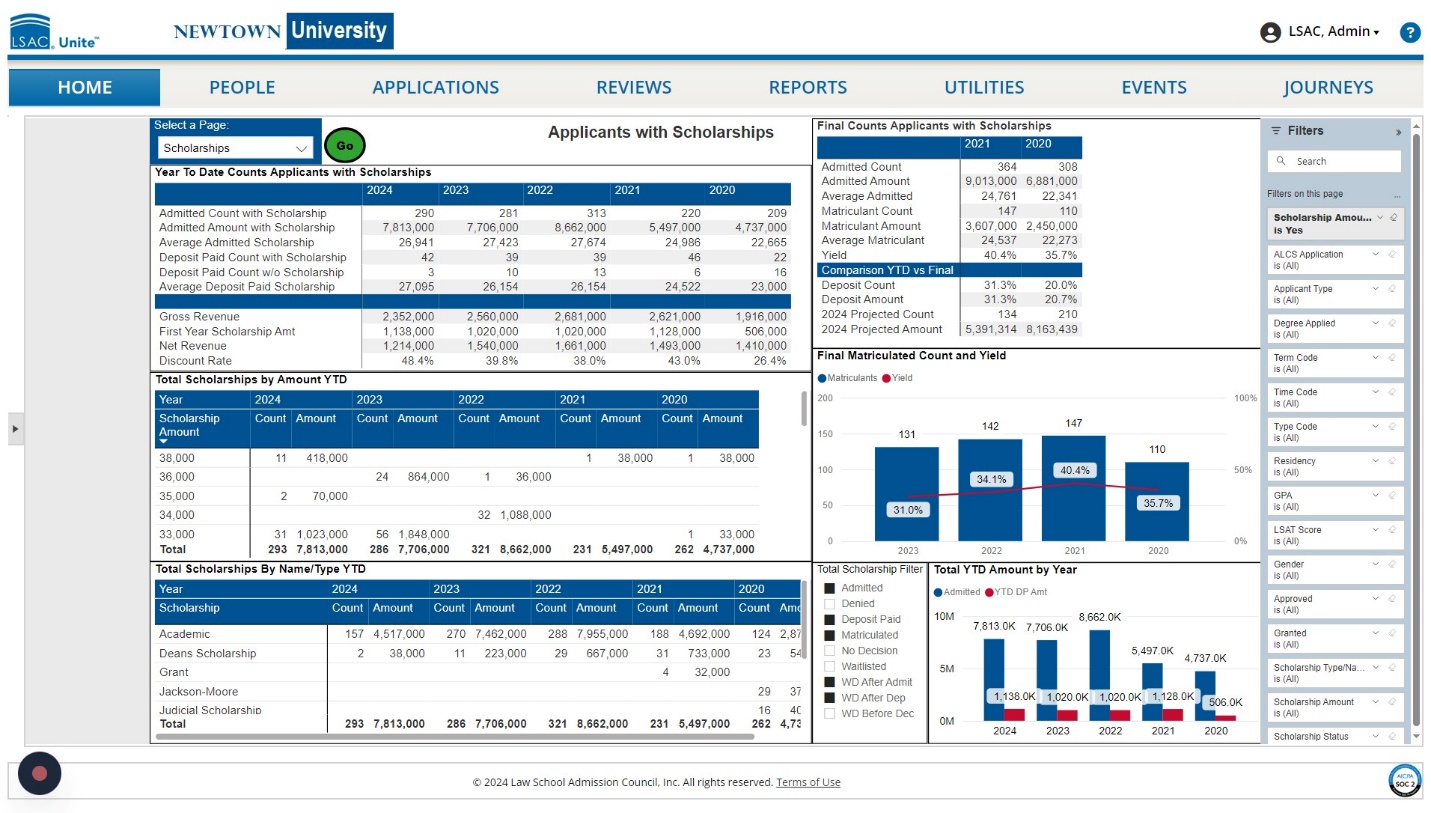
The Year to Date Counts Applicants with Scholarships tile contains rows that calculate gross revenue, net revenue, and the discount rate for JD instances for schools that provide their tuition information to LSAC.
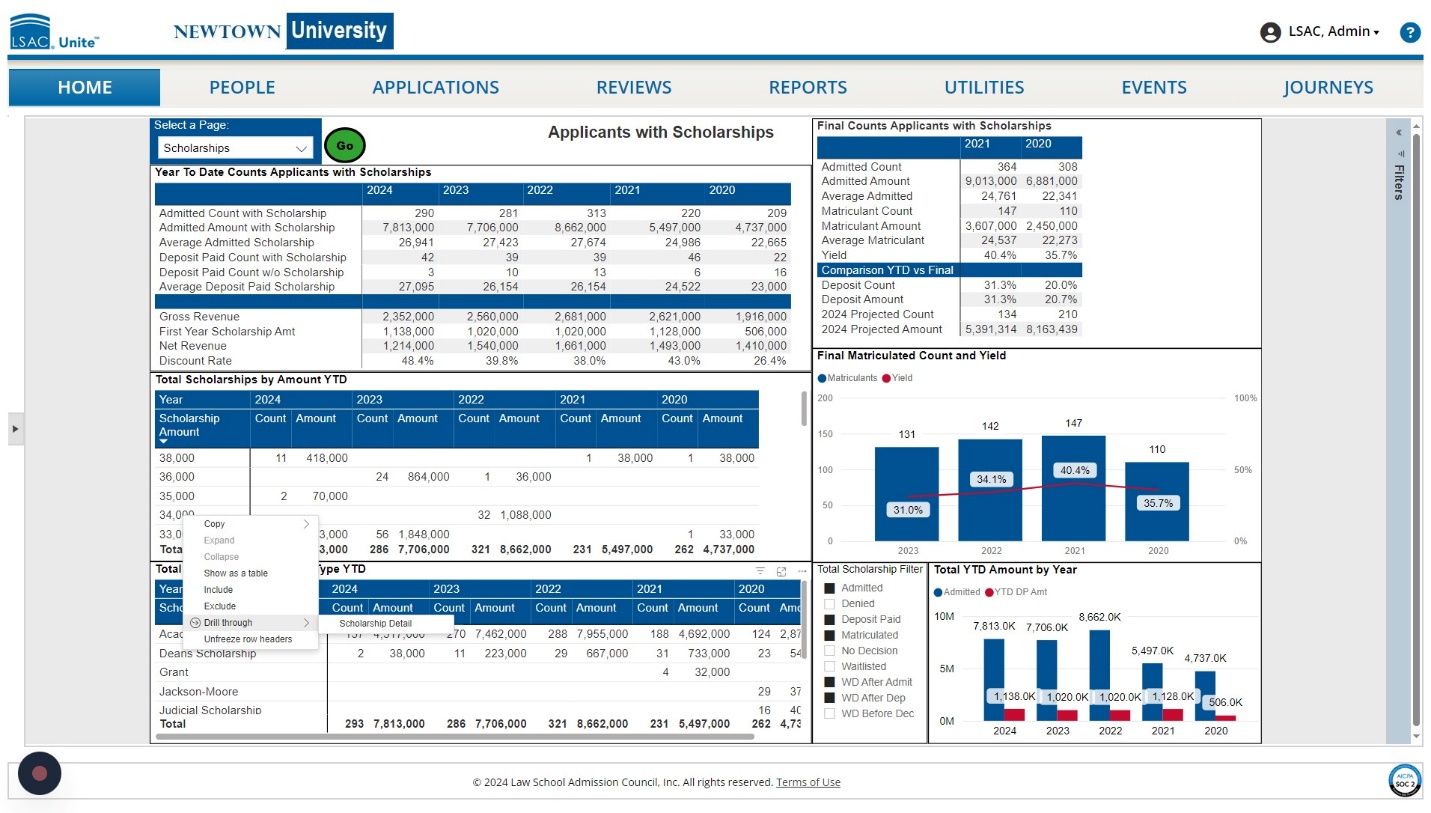
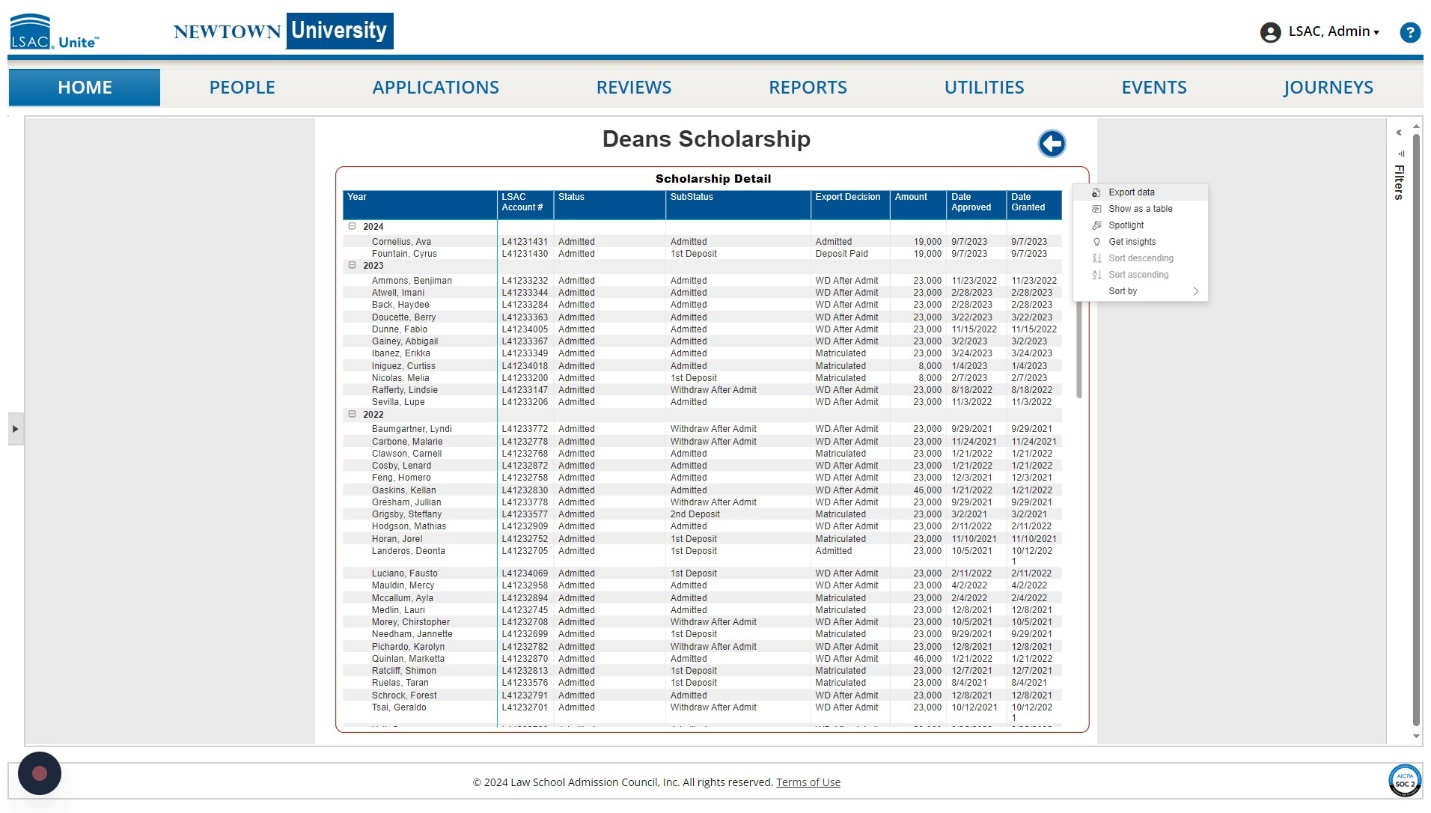
The Total Scholarships by Name/Type YTD tile provides counts and total amount by scholarship name and type for the last 5 years. Right click on any row and select Drill through then Scholarship Detail. This will bring up a list of applicants associated with that scholarship Name/type. Select the arrow to return to the dashboard.